On any average day 15,000 children who are younger than 5 years die. What are they dying from? And are there preventions or treatments that could save their lives?
The leading causes of child death – globally
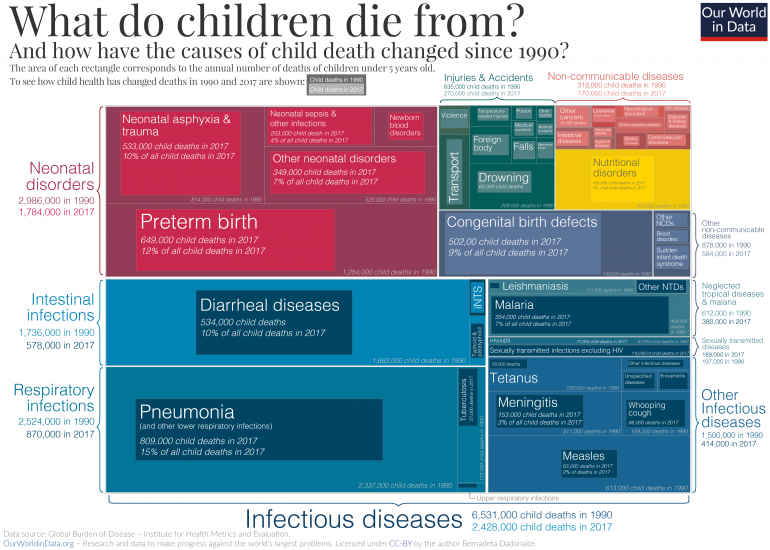
In the chart presented here we see the major causes of death of children under 5 in 2017 compared to 1990. This type of chart is called a treemap, where the area of each box represents the total number of child deaths for each specific cause. The total colored area represents the total number of child deaths in 1990: 11.8 million children died back then, according to the Institute for Health Metrics and Evaluation.1
As the treemap shows, the boxes representing the numbers for child deaths in 2017 are almost always smaller – reflecting the fact that deaths from almost all causes have fallen significantly.2
There are two major exceptions: the number of deaths from AIDS and the deaths caused by invasive non-typhoidal salmonella (iNTS) has increased. Although those numbers were higher in 2017 than 1990, the deaths from both causes have been decreasing since their peak in 2005.
While the total number of child deaths has more than halved from 11.8 million in 1990 to 5.4 million in 2017, the major causes of child deaths have largely remained the same.
15% of all child deaths in 2017 – Pneumonia and other lower respiratory diseases
Almost every seventh child who died in 2017 died of a lower respiratory infection (LRI), which has remained the leading cause of mortality over the past three decades. Pneumonia is the leading LRI. It is caused primarily by bacterial infections.3
12% of deaths – Preterm births and neonatal disorders
When we talk about child mortality we usually refer to mortality of children under the age of 5. But of all children who die, most do not come close to their fifth birthday: the younger a child is, the higher the risk of mortality. Three times as many children die in the first year of their lives than in the next four years. And the majority of children who die in their first year die in the neonatal period, the first 27 days after birth.
Premature birth (being born before the 37th week of gestation) is one of the major determinants of neonatal mortality and therefore complications arising from preterm birth are usually grouped with the neonatal disorders, as we did in our chart.4
Children born prematurely are at high risk of having birth injuries, underdeveloped organs, and contracting infectious diseases.5
10% of deaths – Diarrheal diseases
Every tenth child that died in 2017 died because of some diarrheal disease – rotavirus infection, cholera, shigellosis and other infectious diseases that result in diarrhea. The World Health Organisation (WHO) says that diarrheal diseases are “both treatable and preventable”.6
The fact that diarrheal diseases are the third leading cause of child mortality is simply inexcusable. An increased coverage of oral rehydration therapy – an incredibly simple treatment for diarrhea – could help to prevent many of these deaths.
9% of deaths – Congenital defects
While classed separately from neonatal disorders, congenital birth defects are significant contributors to infant mortality as well.7 Congenital defects are defined as physical or genetic abnormalities present at birth and include neural tube defects, heart defects, Down syndrome, microcephaly and others.
45% of deaths – Infectious diseases
Infectious diseases have always been one of the major causes of child deaths, but the success of vaccination campaigns and antibiotic availability has done a great deal to reduce mortality from infectious diseases. Measles vaccination is a perfect example: the number of measles cases has shrunk by 86% since 1990. The WHO has estimated that between 2000 and 2017 measles vaccination has prevented 21.1 million deaths across Africa.8
Today we also have vaccines available for tuberculosis, meningitis, hepatitis, and whooping cough. The best way to protect children against malaria today is to provide insecticide treated bednets, but a new malaria vaccine implementation program is also underway. 9

How can we prevent children from dying?
We are not writing the child mortality series just to show that too many children are still dying around the world. We want to know what has and can be done about it.
We want to learn from the progress that has been made in reducing child mortality. By better understanding the causes and the available preventions for childhood diseases we want to bring together the research needed to move forward.
In 2003, Jones et al. wrote an article titled “How many child deaths can we prevent this year?”, in which the authors calculated that more than 5.5 million child deaths – 63% of the 9.7 million child deaths in the year 2000 – could have been prevented by a better use of available interventions and treatments.10
We want to know how many child deaths we could prevent today. We know we have better tools, such as new vaccines and better access to multiple treatment options, but the world has also made progress in the meantime, so how has that percentage number changed? And how could we do better still?
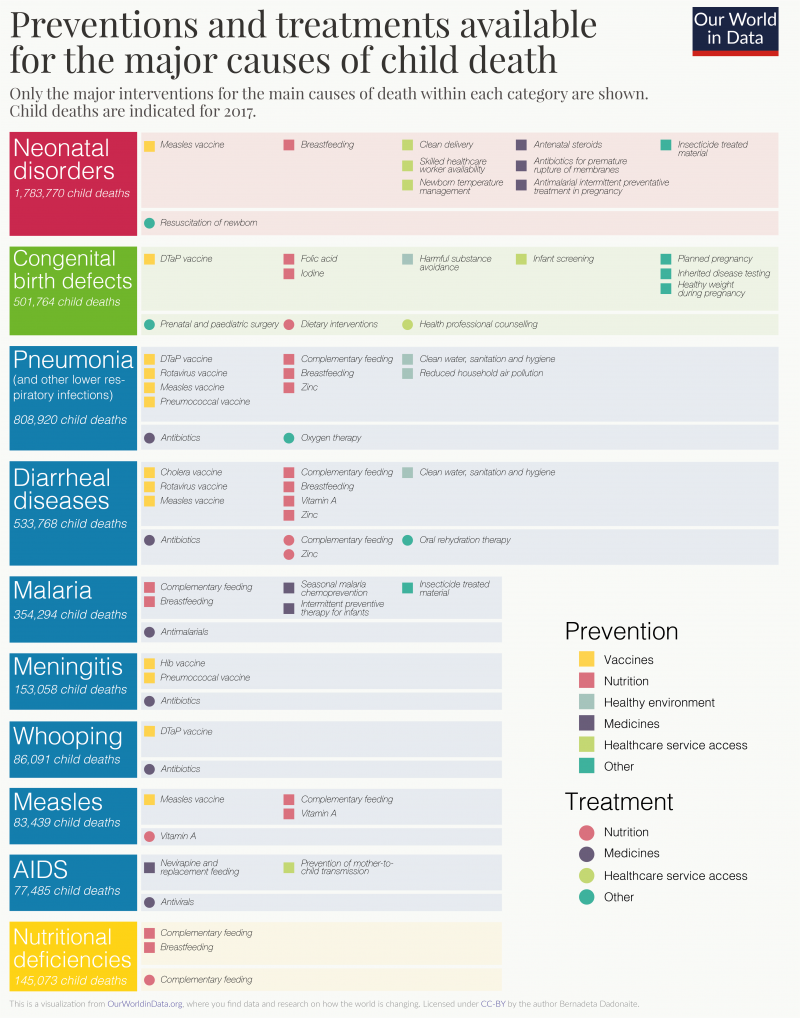
Using the foundation provided by the Jones et al. paper, we attempted to make a list of treatments and preventions the world has available today to fight child mortality. We show that list in the visualization here.
We will use this list as a guide for the future posts on child mortality. It should help to understand how the progress in decreasing child mortality rates has been achieved and where we could do better. In the upcoming posts we will review in more depth the literature on each disease, prevention and treatment.


